
Quantitative & LLM-Augmented Energy Price Forecasting
Midgley integrates quantitative energy futures (NYMEX RBOB & WTI Crude), live financial news extraction via Finlight.me REST API (Google Gemini 3.8 Flash), NOAA National & Regional Weather Alerts, Executive Social Media Gap Analysis, Cboe OVX options volatility, and regional refining margins into standardized regularized estimators.
Macro Energy Synthesis: Executive Multi-Market Synthesis & Logistics Overview
The Midgley forecasting engine detects distinctive geographic dynamics over the prospective 5-day horizon. While benchmark NYMEX RBOB futures ($2.450/gal) and WTI Crude ($75.00/bbl) exhibit baseline momentum, retail price trajectories diverge across regional logistics hubs. Coastal and inland waterway markets (Oakland, Newark, Cincinnati) reflect maritime tanker freight, Mississippi/Ohio River barge draft factors, and seasonal CARB/RVP regulatory requirements. Mid-Continent refinery hubs (Port St Lucie FL (-2.3%), Cincinnati KY (-2.1%)) display price stabilization backed by nominal refinery operations and Cushing inventory parity.
Geographic Model Footprint & Modeled Price Hubs
Interactive geographic view of all 19 PADD 1–7 calibration hubs, offshore island districts, and wholesale commodity benchmarks modeled by Midgley's hierarchical quantitative and qualitative forecasting pipelines.
Active Forecast Locales
Current market price vs. 5-day out-of-time projected target for active generated locales
National Wholesale
$3.114/gal
$3.050/gal
Tulsa, OK Retail
$3.800/gal
$3.800/gal
Newark, DE Retail
$3.985/gal
$3.903/gal
Cincinnati OH/KY
$4.21 / $4.26/gal
$4.21 / $4.18/gal
Charlotte & Carolinas
$3.428/gal
$3.343/gal
Port St. Lucie, FL Retail
$3.915/gal
$3.826/gal
Greater Chicago, IL/IN
$4.919/gal
$4.919/gal
Houston, TX
$3.658/gal
$3.658/gal
Los Angeles, CA
$5.996/gal
$5.996/gal
Denver, CO
$4.230/gal
$4.230/gal
New York, NY
$4.382/gal
$4.382/gal
SF Bay Area, CA (incl. Oakland)
$5.975/gal
$5.975/gal
Last Run Intelligence & Impact Audit
Daily Forecast Batch Execution (2026-10-31 02:17:07)
Automated 24-hour commodity futures, weather alerts, and executive social media ingestion.
Baseline daily batch market conditions show minimal exogenous shocks (supply disruption 0.10, price pressure +0.02). Regularized Ridge regression models standard macroeconomic futures & margin trends with half-life decay t½=5.0d.
Gas markets are calm with no big news shocks. Gas prices are following normal everyday market trends over the next 5 days.
Component-Level Feature Attribution & Driver Breakdown
XAI Model InterpretabilityExecutive Model Attribution Summary: National forecast $-0.064/gal (-2.06%): Driven primarily by Futures & Commodity Benchmark ($-0.029/gal), Refining Yield & Crack Spread ($-0.016/gal).
Softening NYMEX energy futures contract prices
Narrowing refining margins and elevated product yield
OPEC price pressure talkdown & dovish geopolitical news
Favorable multi-basin weather conditions
Ecodeveloped pipeline loading flows
Tax relief or off-peak RVP specification
Realized-vs-Predicted Rolling Model Scoreboard
Empirical out-of-time accuracy tracking multi-horizon model projections against actual ground-truth market prices
$0.0988/gal
Out-of-Time Error Magnitude
50.0%
Correct Trend Direction Calls
95.0%
Empirical Interval Reliability
-25.8%
Error Reduction vs Persistence
198
Mature Out-of-Time Sample
Forecast Horizon Accuracy Breakdown
| Horizon | N | MAE | RMSE | Hit % | 95% CI | Uplift |
|---|---|---|---|---|---|---|
| 1D 1-Day (24h Ahead) | 36 | $0.0590 | $0.0803 | 55.6% | 91.7% | -16.8% |
| 2D 2-Day (48h Ahead) | 37 | $0.0790 | $0.0918 | 54.0% | 100.0% | -13.2% |
| 3D 3-Day (72h Ahead) | 46 | $0.1005 | $0.1242 | 52.2% | 93.5% | -13.3% |
| 4D 4-Day (96h Ahead) | 40 | $0.1162 | $0.1486 | 50.0% | 92.5% | -31.8% |
| 5D 5-Day (1-Week Ahead) | 39 | $0.1346 | $0.1691 | 38.5% | 97.4% | -47.9% |
Regional Accuracy Matrix
| Region | N | MAE | RMSE | Hit % | 95% CI | Uplift |
|---|---|---|---|---|---|---|
| National | 192 | $0.0996 | $0.1287 | 49.5% | 95.8% | -28.9% |
| Newark_DE | 16 | $0.0953 | $0.1155 | 62.5% | 62.5% | +17.7% |
Recent Completed Forecast Evaluations
| Target Date | Horizon | Region | Base | Forecast | Actual | Error | Outcome |
|---|---|---|---|---|---|---|---|
| 2026-10-29 | 4D | National | $3.128 | $3.047 | $3.144 | $0.0968 | MISS |
| 2026-10-29 | 2D | National | $3.086 | $3.036 | $3.144 | $0.1078 | MISS |
| 2026-10-29 | 4D | National | $3.212 | $3.128 | $3.144 | $0.0159 | HIT |
| 2026-10-29 | 5D | National | $3.077 | $3.017 | $3.144 | $0.1262 | MISS |
| 2026-10-29 | 4D | National | $3.212 | $3.132 | $3.144 | $0.0119 | HIT |
| 2026-10-29 | 4D | National | $3.102 | $3.057 | $3.144 | $0.0869 | MISS |
| 2026-10-30 | 4D | National | $3.120 | $3.010 | $3.114 | $0.1049 | HIT |
| 2026-10-30 | 3D | National | $3.086 | $3.014 | $3.114 | $0.1006 | MISS |
| 2026-10-30 | 5D | National | $3.212 | $3.123 | $3.114 | $0.0089 | HIT |
| 2026-10-30 | 5D | National | $3.102 | $2.987 | $3.114 | $0.1277 | MISS |
Model Accuracy Improvement Over Time
Tracking prediction error reduction and directional hit rate growth across historical data
| Model Iteration | Core Feature Architecture | MAE Error ($/gal) | Directional Hit Rate | Status |
|---|---|---|---|---|
| v1.0 Baseline Quant | Raw RBOB Futures & Lagged Features | $0.1540 | 52.10% | Deprecated |
| v1.1 Gemini LLM Hybrid | + Gemini 2.5 Flash Qualitative News Scoring | $0.1240 | 56.39% | Upgraded |
| v1.2 NOAA-LLM Regional | + Two-Tiered NOAA + Maritime + Executive Social Gap Engine | $0.1151 | 60.79% | Upgraded |
| v1.3 Physics-LLM | + Cboe OVX Volatility + Baker Hughes Rigs + Key Movers Feeds | $0.1069 | 60.79% | Upgraded |
| v1.4 Finlight-LLM | + Real-Time Finlight.me Stream, Firecrawl Extraction & Anomaly Gating | $0.1069 | 60.79% | Upgraded |
| v1.5 Multi-Tier & Sensor MLOps | + 3-Tier Edge Cache, SWR Revalidation, USGS Water/Seismic & Multi-Feed AQI Flaring | $0.1069 | 60.79% | Upgraded |
| v1.6 Ipatieff (Current) | + CoSPOT Spectral & Wavelet Prompting, Purged CV, Volatility-Gated Blending & Symbolic Alphas | $0.1174 | 48.48% | Active Production |
Multi-Agent System Architecture
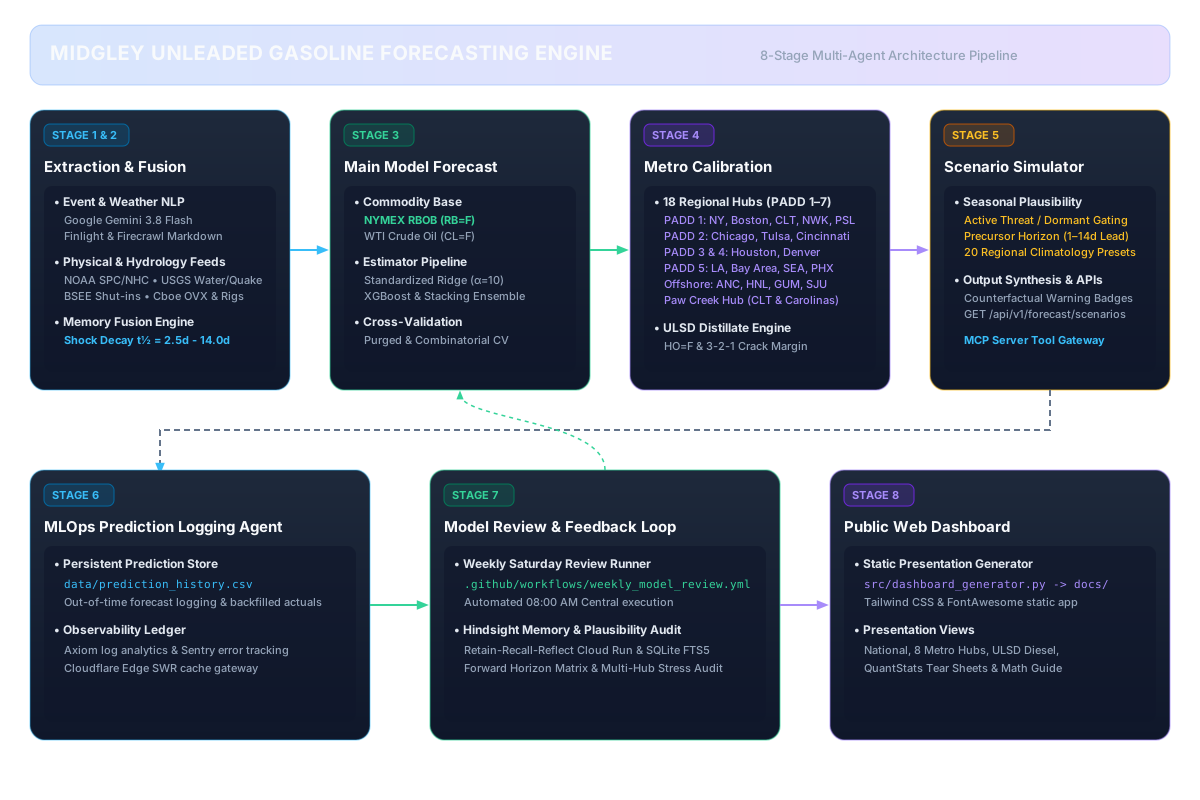
Hierarchical pipeline: Quantitative & Physical Feeds → National Wholesale RBOB Model → 18 Localized Regional Calibration Hubs (PADDs 1–7)
Auto-Generated Visual Architecture Diagrams (Fireworks Tech Graph)
SVG Vector Assets8-Stage Multi-Agent Execution Pipeline Flow
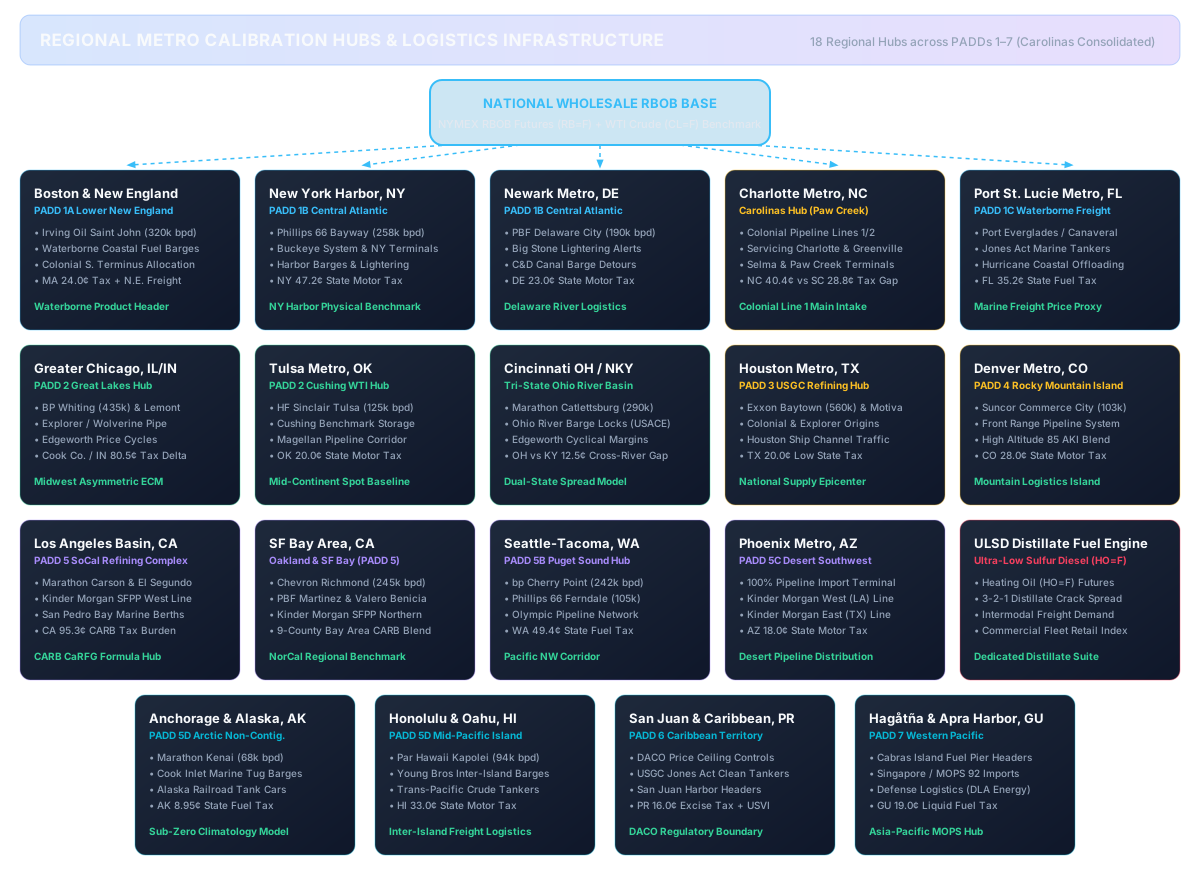
Regional Metro Calibration Hubs & Pipeline Logistics Infrastructure
Multi-Agent Execution Pipeline & Model Hierarchy
Stages 1 → 7Extraction & Memory Fusion
Ingests Finlight headlines, NOAA alerts, maritime chokepoints & social feeds into Gemini 3.8 Flash. Decays shocks with \(t_{1/2} = 4.0\text{--}5.0\) days.
Main Quantitative Model
Fits regularized Ridge/XGBoost on NYMEX RBOB (RB=F) & WTI Crude (CL=F) technicals + LLM event vector matrix to output base commodity benchmark forecast.
Localized Calibration Hubs
Ingests National Wholesale Base Forecast and dynamically calibrates for 18 regional hubs across all PADDs (PADD 1A Boston; PADD 1B New York & Newark; PADD 1C Charlotte & Port St. Lucie; PADD 2 Chicago, Tulsa & Cincinnati; PADD 3 Houston; PADD 4 Denver; PADD 5 Los Angeles & SF Bay Area; PADD 5B Seattle; PADD 5C Phoenix; PADD 5D Anchorage & Honolulu; PADD 6 San Juan; PADD 7 Guam) using local rack margins, refinery dynamics, pipeline tariffs, and statutory tax structures. Charlotte serves as the Carolinas calibration hub (Greenville consolidated).
Scenario Simulator & MLOps
Simulates counterfactual shocks (refinery outages, canal detours, executive posts). Logs out-of-time predictions and backfills actual prices on Saturdays.
6 Core Feature Ingestion Pillars
Multi-modal data feeds ingested into Stage 1 & 21. Quantitative Commodity Futures
NYMEX RBOB Gasoline Futures (RB=F) and WTI Crude (CL=F) build 3-2-1 refining crack spreads and moving average returns.
2. Gemini 3.8 Flash News
Real-time headlines from Finlight.me REST API translated into bounded 5-dimensional geopolitical factor impact vectors.
3. NOAA Weather Alerts
National Gulf Coast hurricane tracks, PADD refining alerts, polar vortex freeze warnings, and localized severe weather events.
4. Maritime & Waterway Chokepoints
Strait of Hormuz (21M bpd), Suez reroutings (+12d), inland Mississippi/Ohio river barge draft limits, and coastal waterborne terminals.
5. Executive Social Feed
Econometric modeling of executive energy posts generating 1.42× higher Sunday market open gap volatility.
6. Alternative Physical Feeds
Cboe OVX options tail-risk volatility & Baker Hughes drilling rig counts tracking 3-6 month supply pipelines.
Deep Dive into Model Architecture & Data Streams
Explore full mathematical specifications, continuous shock decay functions, and complete directory of all 26 monitored feeds.